The Client Dashboard
The Client Dashboard shows one client's ticket health, risk, users and open tickets, with an AI analysis of the relationship and a prediction of what comes next.
Written By Chris Scaminaci
Last updated About 1 hour ago
The Client Dashboard gathers what QuantumOps knows about one client: how healthy their tickets are, how risky the account looks, who the users are, what is open, and what the AI expects next. Technicians and managers open it before a client call or a review.
Before you start: the dashboard opens inside HaloPSA. Opened straight from a browser address bar it shows Access Denied, and it does not ask you to sign in to QuantumOps. Figures come from the tickets QuantumOps has analysed for the client. See The Ticket Dashboard in HaloPSA for how a single ticket is scored.
Open the dashboard
You can reach it in several ways:
- From the client record in HaloPSA, on the Client Dashboard tab. An administrator adds the tab; see Adding QuantumOps tabs to HaloPSA.
- From a ticket: select View Client on the Ticket Dashboard. Back to Ticket in the dashboard's header then returns you to that ticket.
- From the Customer Success Center, and from Taking a call once a caller is identified.
- From the client's name on a User Dashboard.
If your organisation uses the QuantumOps launcher tab in HaloPSA, the Open in the QuantumOps web app button on the launcher card opens this dashboard when the tab is on a client record; see The QuantumOps launcher tab in HaloPSA. The browser extension shows the same information in its Client tab; see Client, User and Agent tabs.
Read the top bar
The header shows the client's name and, where they apply, the VIP Client and High Risk badges. A bell beside them shows the active Q-Notices for the client; select it to list them. See Q-Notices.
The header buttons are Back to Ticket # (only when you came from a ticket), Chat with Qubit and Refresh.
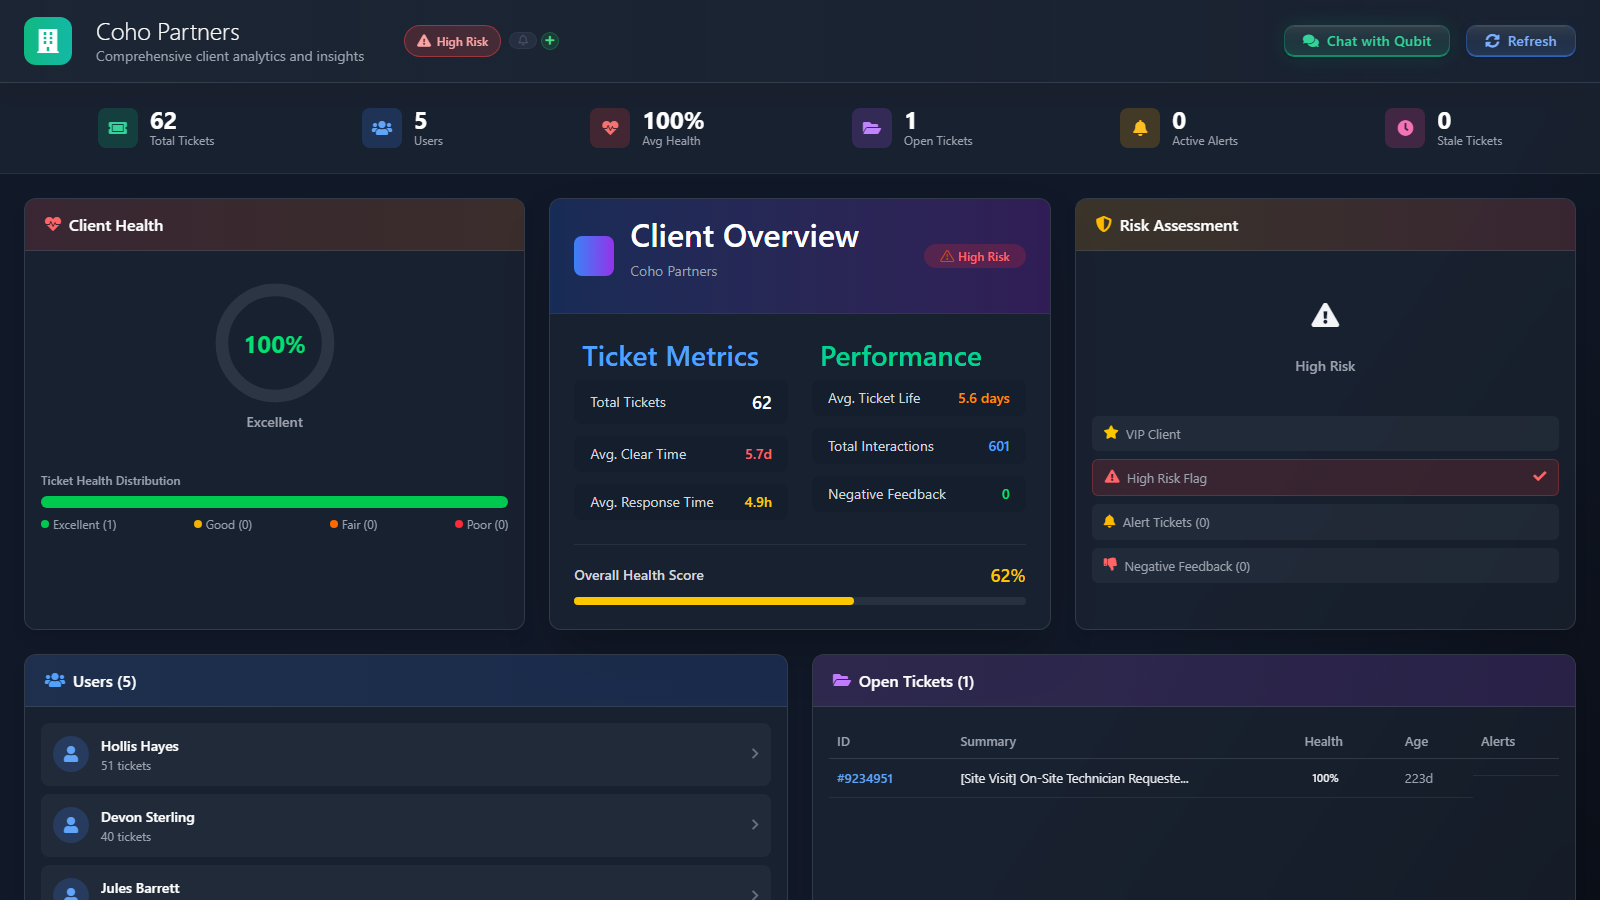
Six counters sit under the header:
Check health and risk
Three cards sit side by side.
Client Health shows the average health of the client's open tickets as a gauge, labelled Excellent (80 or more), Good (60 to 79), Fair (40 to 59) or Needs Attention (below 40). Under it, Ticket Health Distribution shows how many of the client's open tickets fall in Excellent, Good, Fair and Poor. Each screen bands the health score differently, and Needs Attention here means a different range from NEEDS ATTENTION on the Ticket Dashboard; see Where the score shows.
Client Overview splits the account into two groups and adds a score:
- Ticket Metrics: Total Tickets, Avg. Clear Time and Avg. Response Time.
- Performance: Avg. Ticket Life, Total Interactions and Negative Feedback, which counts the tickets that raised a sentiment or tonality alert.
- Overall Health Score: one bar for the whole relationship.
The Overall Health Score is not the average of the ticket health scores, which is why it can read 62% beside an Avg Health of 100%. It averages up to five separate judgements, each worth 100 at its best and falling to 80, 60 and then 30 as the figure worsens:
A time measure that has no figure yet does not take part. A client with the High Risk flag therefore cannot reach 89%, however well the queue runs.
Risk Assessment shows a risk level (Low, Medium, High or Critical) and the factors behind it: VIP Client, High Risk Flag, Alert Tickets and Negative Feedback, each with a count or a tick. The level rises with the High Risk flag (which weighs the most), the VIP flag, more than two alert tickets, any negative feedback, and an average health below 60. Beneath the factors, AI Risk Analysis gives a short reason when the AI analysis has one.
Review users and open tickets
Users lists up to the 20 users with the most tickets, with their ticket counts and a star for a VIP user or a warning for a high-risk user. Select a user to open their User Dashboard. No users found appears when QuantumOps has no users on record for the client.
Open Tickets lists the 15 newest open tickets with their ID, Summary, Health, Age and Alerts. A red mark in Alerts means a sentiment or tonality alert, and a clock means the ticket is stale. Select a row to open the Ticket Dashboard for it. No open tickets appears when the client has none.
Read the AI analysis
The lower part of the page is written by AI from the client's tickets. Use with care. AI profiles are inferred from ticket text, so check them before you rely on them.
When there is no analysis yet, an AI Predictive Insights card appears in place of Comprehensive Analysis. It reads No Insights Available and tells you to select Refresh. Ticket Volume Trend still shows. While the AI works, the columns read Generating... or Analyzing....
Refresh the analysis
Different figures update in different ways:
- The counters, health figures and metrics are recomputed in the background every 30 minutes. A dashboard that is open updates when new figures arrive.
- The AI analysis refreshes by itself when you open the dashboard and the stored analysis is more than a day old.
- Refresh re-runs the AI analysis now. It uses AI, so it counts toward your organisation's AI usage: use it when you need fresh insights, not on every visit.
While it runs, the page shows AI Analysis in Progress. If the refresh could not finish, or had nothing to analyse, a line above the analysis says so. When the client has no open tickets, for example, the stored analysis is kept and the line says that.
Chat with Qubit about the client
Chat with Qubit opens a chat about this client in a new window. See Chat with Qubit from a HaloPSA dashboard.
If the page does not load
Loading Client Data appears while the page fetches the client. Unable to Load Client Data appears when it cannot, with a Try Again button. The page reports the failure rather than showing an empty dashboard, which would look like a client with no tickets.
Related pages
- The User Dashboard: the same view for one person at the client.
- The Ticket Dashboard in HaloPSA: the single-ticket view the figures are built from.
- Chat with Qubit from a HaloPSA dashboard: the chat behind Chat with Qubit.
- Customer Success Center: risk signals across all clients at once.
- Client, User and Agent tabs: the same client view in the browser extension.
- Support memory: the memory behind the Memory Graph card.
Was this helpful?
Still need help? Ask the team