The Agent Dashboard
The Agent Dashboard shows one technician's current workload, schedule, performance figures and AI profile, for supervisors and for the technician.
Written By Chris Scaminaci
Last updated About 1 hour ago
The Agent Dashboard shows one technician's workload and performance: what they are carrying now, how their week is going, when they work, and an AI profile of how they work. Supervisors open it before a one-to-one; a technician can use it to see their own load.
Before you start: this page is made for HaloPSA's frame, and there is no HaloPSA tab for it yet (see the next section). Opened straight from a browser address bar it shows Access Denied, and it does not ask you to sign in to QuantumOps. It is about one technician at a time. For the whole team side by side, use the Agent Performance Hub.
Open the dashboard
You cannot add the Agent Dashboard to HaloPSA as a tab yet. Its card is listed as Coming Soon in the Dashboard Setup step of the setup wizard and under Dashboards in Q-Director Settings, and its Copy button is switched off. Until HaloPSA offers what the tab needs, use the Agent tab of the browser extension, which shows the same information; see The Agent tab. The sections below explain each measure. See Adding QuantumOps tabs to HaloPSA for the other dashboards.
Read the top bar
The header shows the technician's name, their team and role, and their current status, for example Online, Lunch or Leave. The header's colour follows the status. A Supervisor badge appears for supervisors. A bell shows the active Q-Notices for the technician; select it to list them. See Q-Notices. Refresh clears the stored figures for this technician and loads them again; it does not re-run the AI profile.
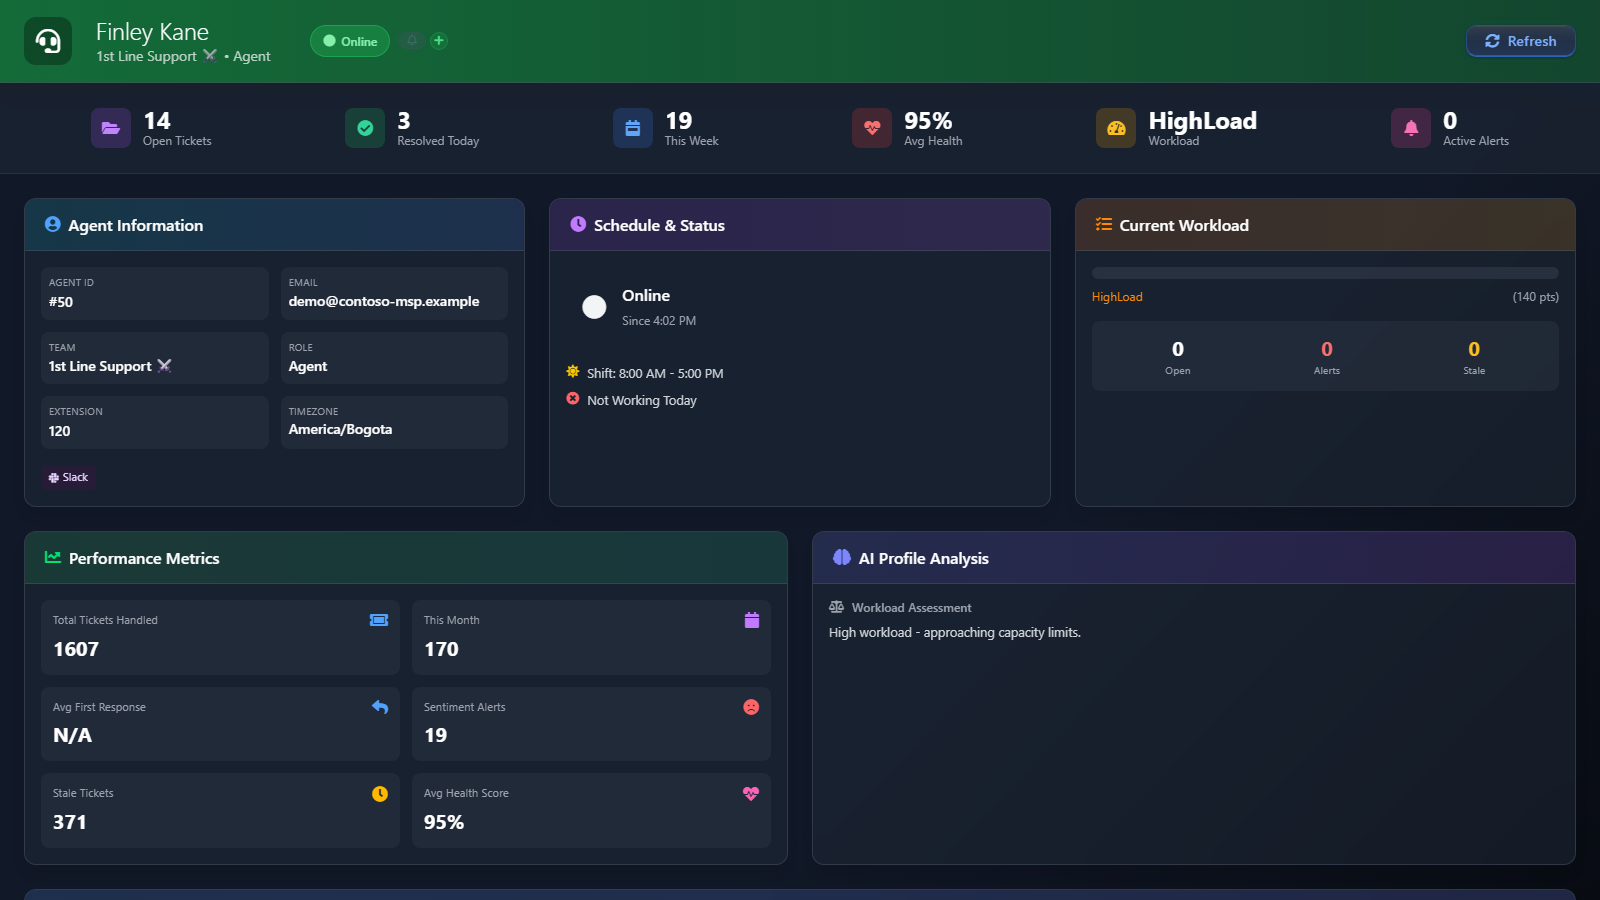
Six counters sit under the header:
Check the person and their schedule
Agent Information lists the Agent ID, Email, Team, Role, Extension and Timezone. A Slack or Teams badge appears when the technician's account is linked to that product. The extension number is what links a technician to their call recordings. See Call recordings.
Schedule & Status shows the current status and since when, the shift hours, and whether the technician is Working Today or Not Working Today. A scheduled lunch time and a leave reason appear when they apply.
Check the workload
Current Workload shows a gauge with the workload level and the points behind it, then the counts Open, Alerts and Stale. Oldest ticket: appears when there is one.
The level follows the number of open tickets, and the points are ten per open ticket:
These are the same five levels as the Fully available, Available, Moderate load, High load and Overloaded levels on Home and in Agent Performance Hub, but this screen writes them as one word and its cut-offs at 10 and 15 open tickets are fixed. Home and the hub take the cut-offs for High load and Overloaded from your Workload thresholds, which default to 10 and 15, and they count workable tickets, which leave out on-hold tickets while Exclude SLA hold is on. The same technician can therefore show a different level there. See Check agent workload.
The Open Tickets counter and the level are counted in HaloPSA when the page loads. The Open, Alerts and Stale counts in Current Workload are counted from the tickets assigned to the technician that QuantumOps has analysed, so they can differ from the Open Tickets counter.
Read the performance figures
Performance Metrics shows the figures below. Total Tickets Handled, Sentiment Alerts, Stale Tickets and Avg Health Score cover every ticket on record for the technician. This Month and Avg First Response use shorter windows.
Read the AI profile
AI Profile Analysis describes how the technician works. Its sections appear as the profile has content for them:
Profiles are generated from the Agent Performance Hub; see Agent detail and profiles.
Use with care. AI profiles are inferred from ticket text, so check them before you rely on them.
Review their tickets and status changes
Current Open Tickets lists the technician's oldest open tickets, up to fifteen, with Ticket, Client, Summary, Category, Age, Health and Alerts. Select a row to open the Ticket Dashboard for it.
Recent Status Changes lists the last ten changes of status, for example from Online to Lunch, with the time and any leave reason.
If the page does not load
Loading Agent Data appears while the page fetches the technician. Unable to Load Agent Data appears when it cannot, for example when no such agent is known, with a Try Again button.
Related pages
- Agent Performance Hub: the whole team, compared.
- Agent detail and profiles: the long-form view of one agent, and where profiles are generated.
- Client, User and Agent tabs: the same view in the browser extension.
- Call recordings: where the technician's extension number is used.
Was this helpful?
Still need help? Ask the team